> ## Documentation Index
> Fetch the complete documentation index at: https://docs.vigolium.com/llms.txt
> Use this file to discover all available pages before exploring further.
# Web UI
> Start Vigolium's built-in web UI with vigolium server, then visualize scan data, inspect findings, choose modules, launch scans, and adjust configuration.
Run `vigolium server` to start the Vigolium web server and open the built-in Web UI.
```bash theme={null}
vigolium server
```
By default, the server listens on `http://localhost:9002`. Open that URL in your browser to use the dashboard.
 For shared or production use, set `VIGOLIUM_API_KEY` before starting the server. Use `vigolium server -A` only for local development when you intentionally want to disable authentication.
```bash theme={null}
# Start with API authentication
export VIGOLIUM_API_KEY=my-secret-key
vigolium server
# Bind to a specific host and port
vigolium server --host 127.0.0.1 --service-port 9002
# Development only: disable API authentication
vigolium server -A
```
## What you can do in the Web UI
The Web UI gives you a visual workspace for the data Vigolium stores in its local database. Use it when you want to explore results, tune scans, or work across projects without staying in the terminal.
* View project-level scan summaries and severity breakdowns.
* Browse, search, and filter findings.
* Open finding details with request, response, payload, and evidence context.
* Review HTTP records collected from CLI scans, API ingestion, or proxy ingestion — filter them by source (scan, ingestion, proxy) with the records source dropdown, and copy any request as a ready-to-run `curl` command.
* See available scanner modules, including active and passive modules.
* Start new scans and monitor scan progress.
* Modify scope and scanner configuration from the server-backed config surface.
For shared or production use, set `VIGOLIUM_API_KEY` before starting the server. Use `vigolium server -A` only for local development when you intentionally want to disable authentication.
```bash theme={null}
# Start with API authentication
export VIGOLIUM_API_KEY=my-secret-key
vigolium server
# Bind to a specific host and port
vigolium server --host 127.0.0.1 --service-port 9002
# Development only: disable API authentication
vigolium server -A
```
## What you can do in the Web UI
The Web UI gives you a visual workspace for the data Vigolium stores in its local database. Use it when you want to explore results, tune scans, or work across projects without staying in the terminal.
* View project-level scan summaries and severity breakdowns.
* Browse, search, and filter findings.
* Open finding details with request, response, payload, and evidence context.
* Review HTTP records collected from CLI scans, API ingestion, or proxy ingestion — filter them by source (scan, ingestion, proxy) with the records source dropdown, and copy any request as a ready-to-run `curl` command.
* See available scanner modules, including active and passive modules.
* Start new scans and monitor scan progress.
* Modify scope and scanner configuration from the server-backed config surface.

 ## Start scans from the dashboard
Use the scan controls to launch a background scan against a URL, imported traffic, or records already stored in the project. The Web UI sends the request to the same server API that powers `vigolium scan`, so the scan output lands in the same database and appears in the findings views as soon as results are written.
When starting a scan, you can tune common options such as:
* Target URL or stored HTTP records.
* Scan strategy and intensity.
* Specific modules or module tags.
* Scope settings.
* Active/passive module behavior.
## Start scans from the dashboard
Use the scan controls to launch a background scan against a URL, imported traffic, or records already stored in the project. The Web UI sends the request to the same server API that powers `vigolium scan`, so the scan output lands in the same database and appears in the findings views as soon as results are written.
When starting a scan, you can tune common options such as:
* Target URL or stored HTTP records.
* Scan strategy and intensity.
* Specific modules or module tags.
* Scope settings.
* Active/passive module behavior.
 ## Use it with the Burp Suite extension
`vigolium server` is also the local backend for the **Vigolium Burp extension**. The extension connects to your running server, ingests traffic through `/api/ingest-http`, and triggers scans through the server scan APIs. Findings then appear in both Burp and the Web UI because they are stored in the same Vigolium database.
Get the extension source and installation files from the [Vigolium Burp Suite extension repository](https://github.com/vigolium/burp-vigolium).
## Use it with the Burp Suite extension
`vigolium server` is also the local backend for the **Vigolium Burp extension**. The extension connects to your running server, ingests traffic through `/api/ingest-http`, and triggers scans through the server scan APIs. Findings then appear in both Burp and the Web UI because they are stored in the same Vigolium database.
Get the extension source and installation files from the [Vigolium Burp Suite extension repository](https://github.com/vigolium/burp-vigolium).
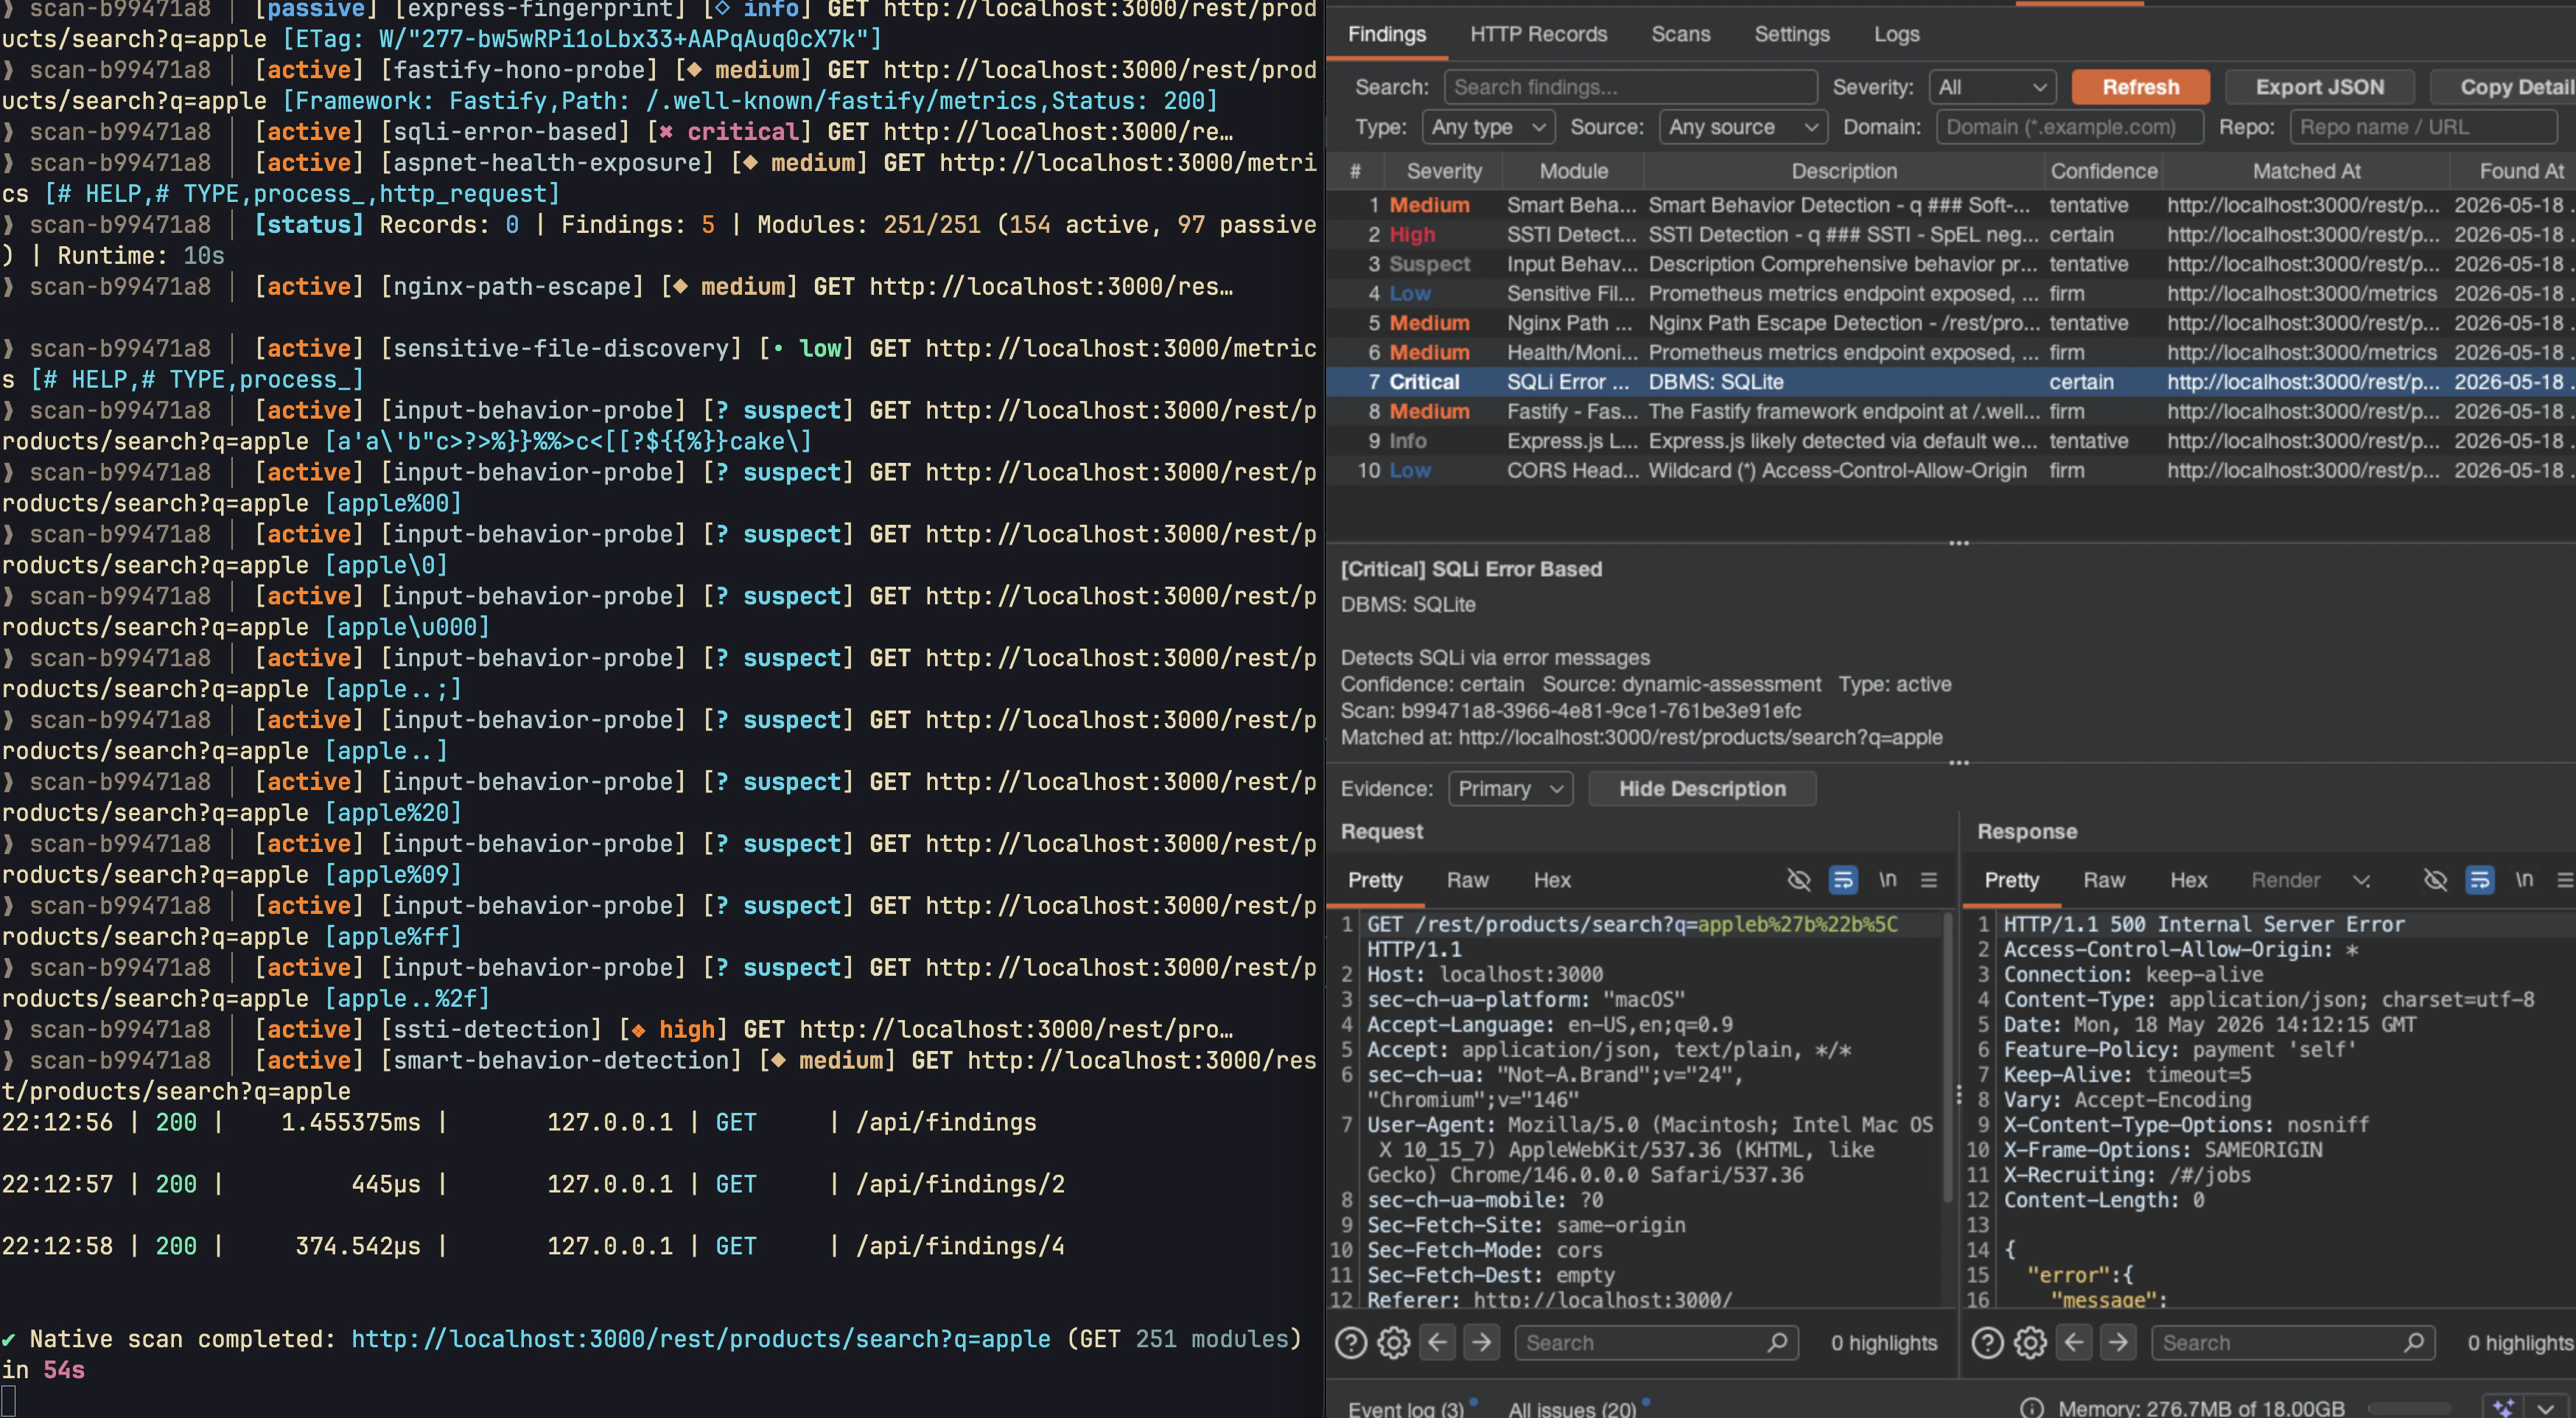 **What you get inside Burp**
* A **Findings** table fed live by Vigolium as it scans.
* The full **Request / Response** pair for the selected finding.
* A scan stream showing each module as it runs against the ingested request.
* Context-menu actions for **Send to Vigolium**, **Send to Native Scan**, and **Send to Agentic Scan**.
### Configure the extension
Open the **Settings** tab in the Vigolium panel and point the extension at your local server.
**What you get inside Burp**
* A **Findings** table fed live by Vigolium as it scans.
* The full **Request / Response** pair for the selected finding.
* A scan stream showing each module as it runs against the ingested request.
* Context-menu actions for **Send to Vigolium**, **Send to Native Scan**, and **Send to Agentic Scan**.
### Configure the extension
Open the **Settings** tab in the Vigolium panel and point the extension at your local server.
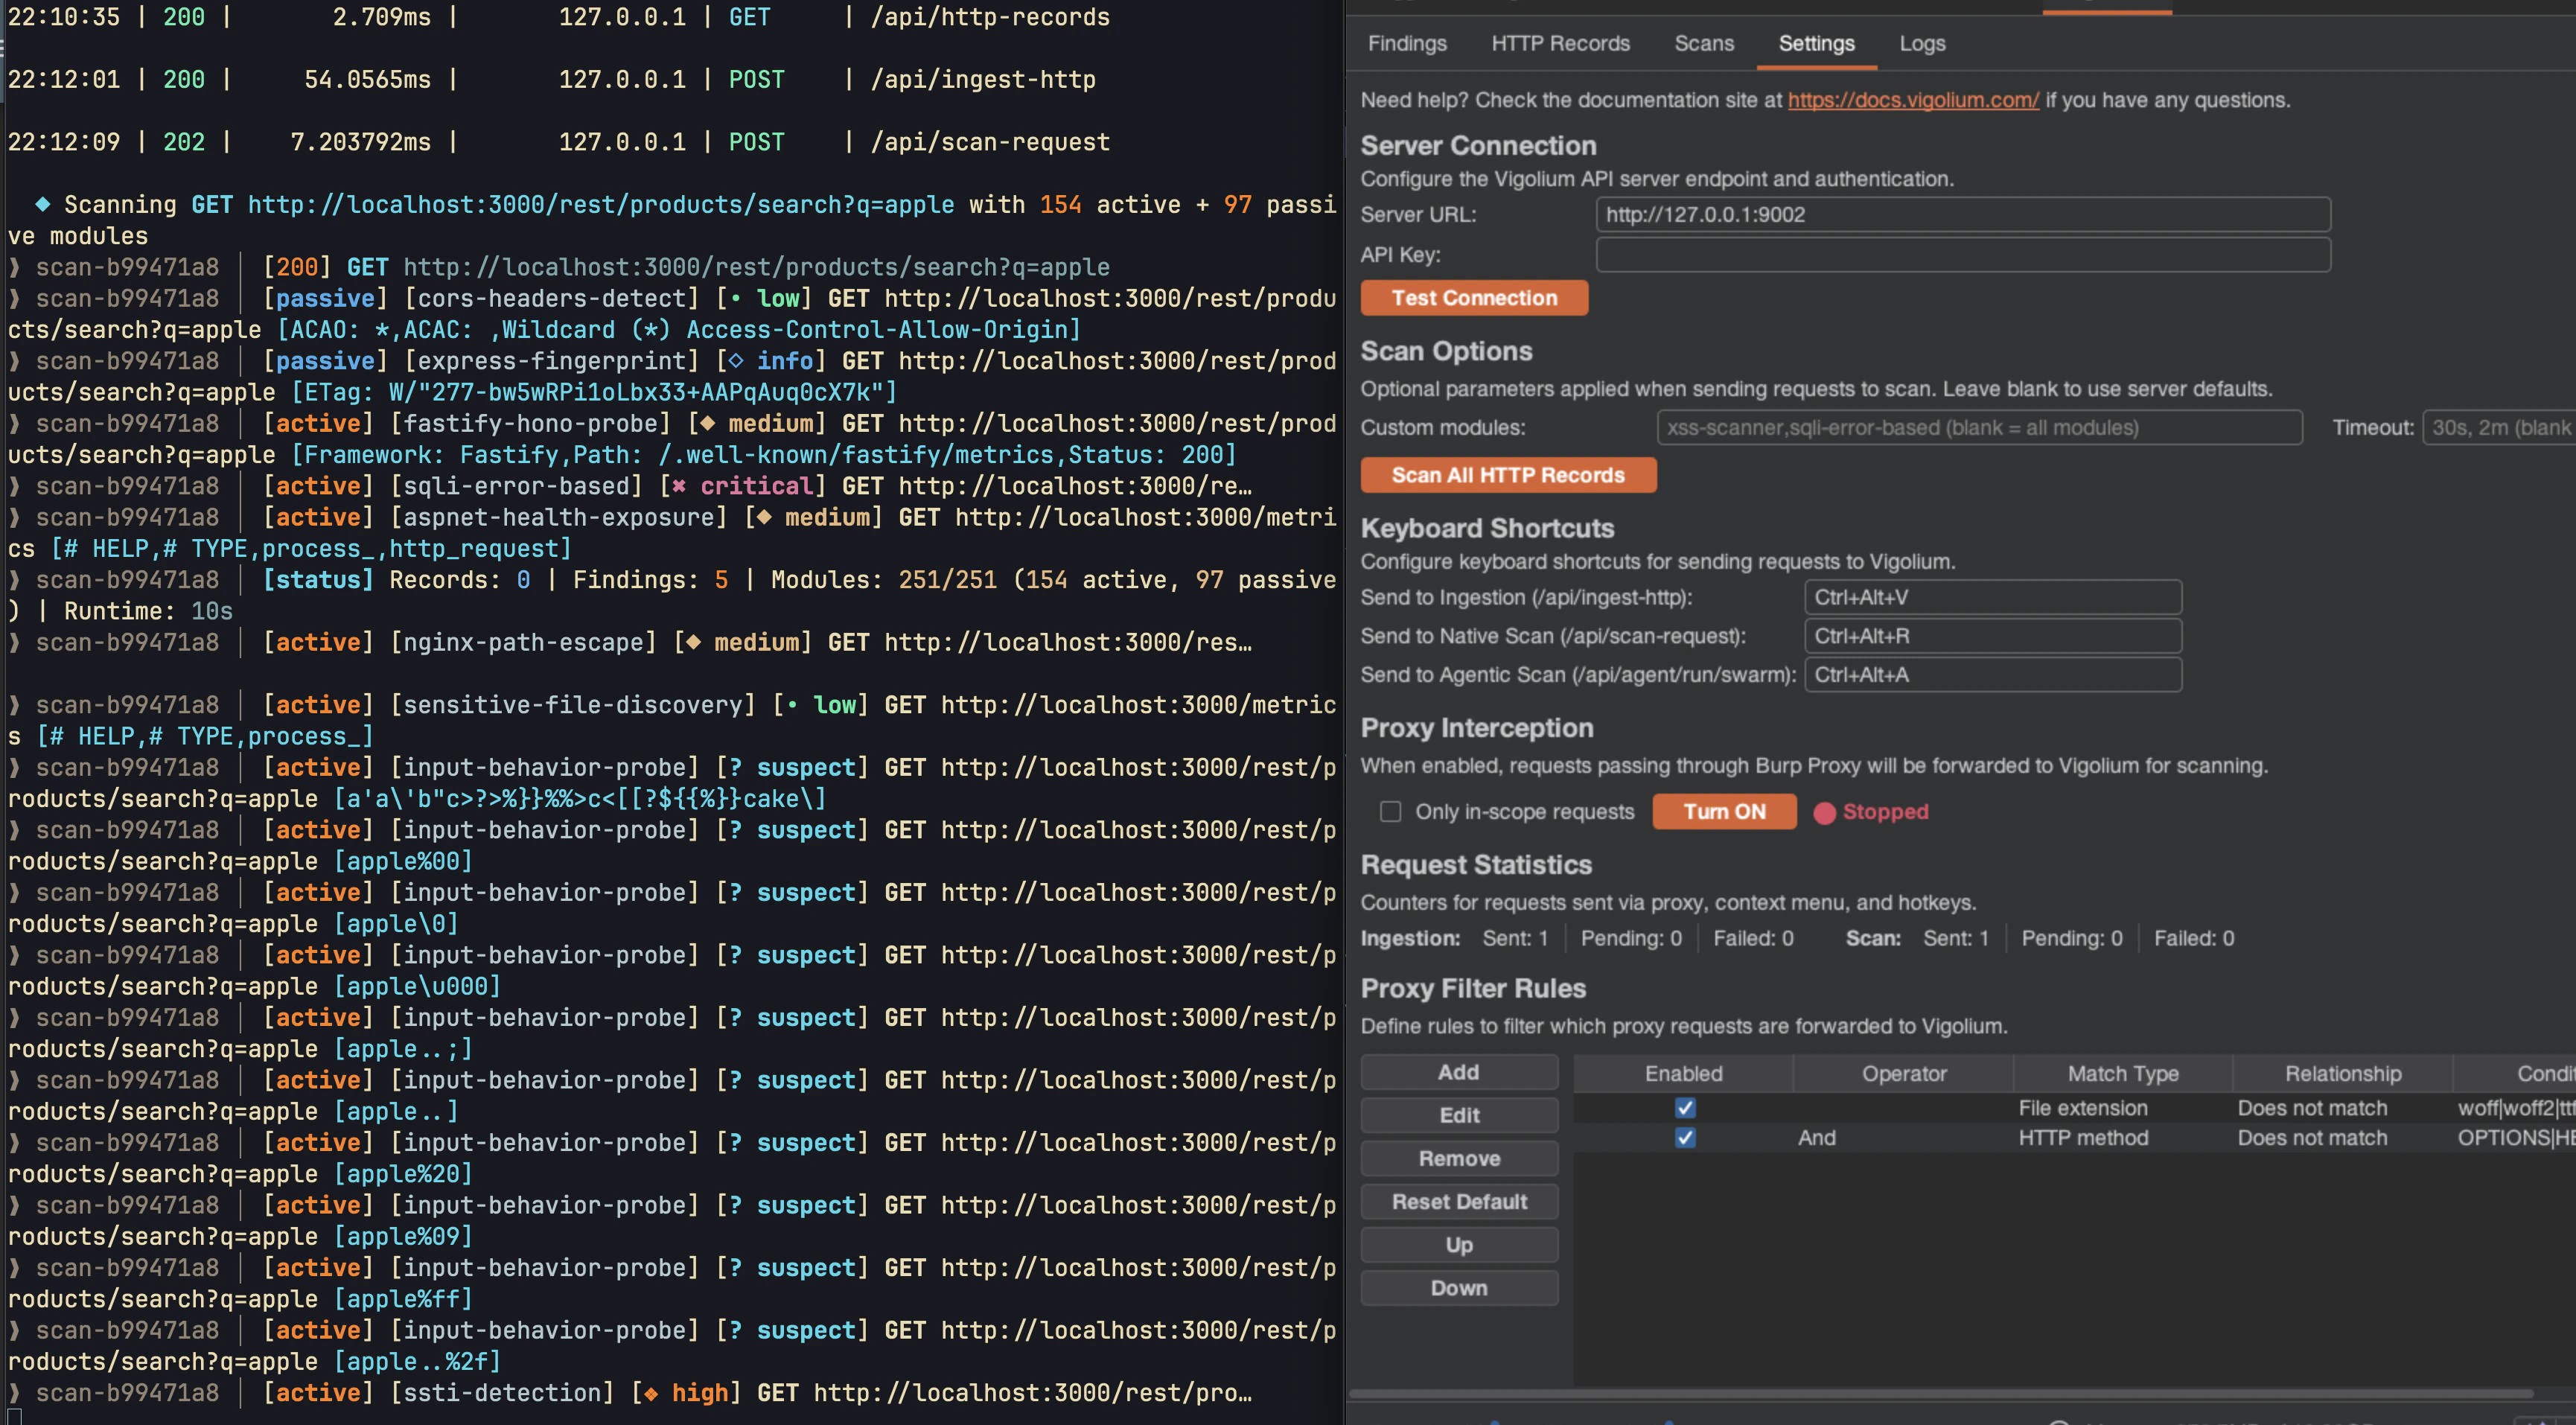 | Section | What it controls |
| ---------------------- | ---------------------------------------------------------------------------------------------------------------------------------------------- |
| **Server Connection** | Vigolium API endpoint, such as `http://localhost:9002`, and the API key from `VIGOLIUM_API_KEY`. Click **Test Connection** before ingesting. |
| **Scan Options** | Optional parameters sent with every ingested request, such as timeout, scan ID, or module overrides. Leave blank for server defaults. |
| **Keyboard Shortcuts** | Bindings for **Send to Vigolium**, **Send to Native Scan**, and **Send to Agentic Scan**. |
| **Proxy Interception** | Forward requests flowing through Burp Proxy to Vigolium. Combine with **Only in-scope requests** to limit ingestion to your Burp target scope. |
| **Request Statistics** | Live counters for forwarded, succeeded, failed, queued, and in-flight scan counts. |
| **Proxy Filter Rules** | Allow or deny traffic by file extension, HTTP method, or host so static assets and out-of-scope hosts do not pollute the database. |
### Burp workflow
1. Start the Vigolium server with an API key.
```bash theme={null}
export VIGOLIUM_API_KEY=my-secret-key
vigolium server
```
2. Load the extension in Burp with **Extensions** > **Add**, open the **Vigolium** tab, fill in **Server Connection**, and click **Test Connection**.
3. Ingest traffic in one of two ways:
* Enable **Proxy Interception** to forward in-scope requests from Burp Proxy into Vigolium.
* Right-click a request in Proxy, Repeater, or Target and choose **Send to Vigolium**.
4. Start a scan from Burp with **Send to Native Scan** or **Send to Agentic Scan**. Vigolium preserves headers, cookies, body fields, query parameters, and path segments as scanner input.
5. Watch findings stream into Burp and the Web UI. Selecting a finding lets you inspect the matched request and response evidence.
The extension does not run the scanner inside Burp's JVM. It forwards requests to the Vigolium server and polls the server for findings, so scans use your Vigolium server resources and remain available after Burp closes.
For lower-level ingestion details, see [Server ingestion](/server-mode/ingestion).
## Review available modules
The dashboard exposes the module registry so you can see what Vigolium can test before launching a scan. Use module search and filters to find checks by vulnerability class, technology, resource cost, or module type.
For CLI parity, you can list modules from the terminal too:
```bash theme={null}
vigolium module ls
vigolium module ls --tag xss
vigolium module ls --type active
```
You can also query modules through the server API:
```bash theme={null}
curl -s http://localhost:9002/api/modules \
-H "Authorization: Bearer my-secret-key" | jq .
```
See [Modules reference](/native-scan/modules-reference) for scanner module concepts and [Modules API](/api-references/modules) for API fields.
## Adjust configuration
Configuration changes made through the Web UI use the same server configuration model described in the CLI docs. Use the UI when you want to adjust scan behavior interactively, then keep durable settings in `~/.vigolium/vigolium-configs.yaml`.
Common configuration tasks include:
* Updating scope rules.
* Changing concurrency, rate limits, and per-host limits.
* Enabling or disabling module groups.
* Adjusting CORS or server behavior.
* Reviewing project-level data separation.
For complete configuration details, see [Configuration](/getting-started/configuration) and [Running the Server](/server-mode/running-the-server).
| Section | What it controls |
| ---------------------- | ---------------------------------------------------------------------------------------------------------------------------------------------- |
| **Server Connection** | Vigolium API endpoint, such as `http://localhost:9002`, and the API key from `VIGOLIUM_API_KEY`. Click **Test Connection** before ingesting. |
| **Scan Options** | Optional parameters sent with every ingested request, such as timeout, scan ID, or module overrides. Leave blank for server defaults. |
| **Keyboard Shortcuts** | Bindings for **Send to Vigolium**, **Send to Native Scan**, and **Send to Agentic Scan**. |
| **Proxy Interception** | Forward requests flowing through Burp Proxy to Vigolium. Combine with **Only in-scope requests** to limit ingestion to your Burp target scope. |
| **Request Statistics** | Live counters for forwarded, succeeded, failed, queued, and in-flight scan counts. |
| **Proxy Filter Rules** | Allow or deny traffic by file extension, HTTP method, or host so static assets and out-of-scope hosts do not pollute the database. |
### Burp workflow
1. Start the Vigolium server with an API key.
```bash theme={null}
export VIGOLIUM_API_KEY=my-secret-key
vigolium server
```
2. Load the extension in Burp with **Extensions** > **Add**, open the **Vigolium** tab, fill in **Server Connection**, and click **Test Connection**.
3. Ingest traffic in one of two ways:
* Enable **Proxy Interception** to forward in-scope requests from Burp Proxy into Vigolium.
* Right-click a request in Proxy, Repeater, or Target and choose **Send to Vigolium**.
4. Start a scan from Burp with **Send to Native Scan** or **Send to Agentic Scan**. Vigolium preserves headers, cookies, body fields, query parameters, and path segments as scanner input.
5. Watch findings stream into Burp and the Web UI. Selecting a finding lets you inspect the matched request and response evidence.
The extension does not run the scanner inside Burp's JVM. It forwards requests to the Vigolium server and polls the server for findings, so scans use your Vigolium server resources and remain available after Burp closes.
For lower-level ingestion details, see [Server ingestion](/server-mode/ingestion).
## Review available modules
The dashboard exposes the module registry so you can see what Vigolium can test before launching a scan. Use module search and filters to find checks by vulnerability class, technology, resource cost, or module type.
For CLI parity, you can list modules from the terminal too:
```bash theme={null}
vigolium module ls
vigolium module ls --tag xss
vigolium module ls --type active
```
You can also query modules through the server API:
```bash theme={null}
curl -s http://localhost:9002/api/modules \
-H "Authorization: Bearer my-secret-key" | jq .
```
See [Modules reference](/native-scan/modules-reference) for scanner module concepts and [Modules API](/api-references/modules) for API fields.
## Adjust configuration
Configuration changes made through the Web UI use the same server configuration model described in the CLI docs. Use the UI when you want to adjust scan behavior interactively, then keep durable settings in `~/.vigolium/vigolium-configs.yaml`.
Common configuration tasks include:
* Updating scope rules.
* Changing concurrency, rate limits, and per-host limits.
* Enabling or disabling module groups.
* Adjusting CORS or server behavior.
* Reviewing project-level data separation.
For complete configuration details, see [Configuration](/getting-started/configuration) and [Running the Server](/server-mode/running-the-server).